Mental breakdown, anger and despair, young male character throwing a monitor, office life,

9 tips to increase remote design team engagement

Improving remote team engagement isn’t easy. But it’s essential. Three years after the COVID-19 pandemic, remote teams are nothing new for most companies. But effective remote team engagement may remain a struggle. Employees’ expectations about work culture and environments have changed. And it’s not just resignations managers need to worry about. According to Gallup, workforce…

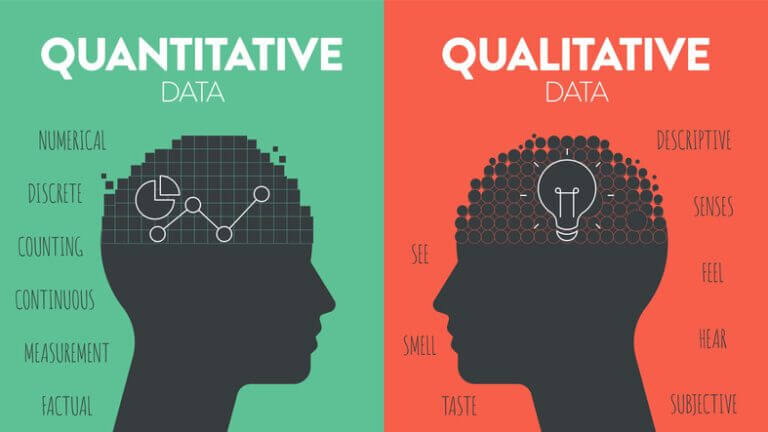
The difference of Quantitative Data (numerical measurements, statistical analysis) and Qualitative Data (observations and subjective interpretations) icon infographic diagram banner template. Vector.

Why you need both quantitative and qualitative data

Many people rely on only one type of data, usually the numbers. Numbers are helpful, but they don’t always tell you why something is happening. On the other hand, focusing only on user interviews or open-ended feedback might not show you how common an issue really is. By combining both types of data, you’ll see a full picture of how your product or website is performing.

Scrum methodology, business process optimisation, young black female character pointing at the diagram and explaining how it works

Product-centric vs user-centric: Which is better for SaaS?

Product-centric and user-centric design approaches are fundamentally different B2B and B2C SaaS companies can choose between a product-centric and user-centric approach. So which one is better? In this article, we’ll explain the differences between a product-centric approach and a user-centric one. We’ll also explain the pros and cons of each one. Customer centric vs user…